resenting communications industry development
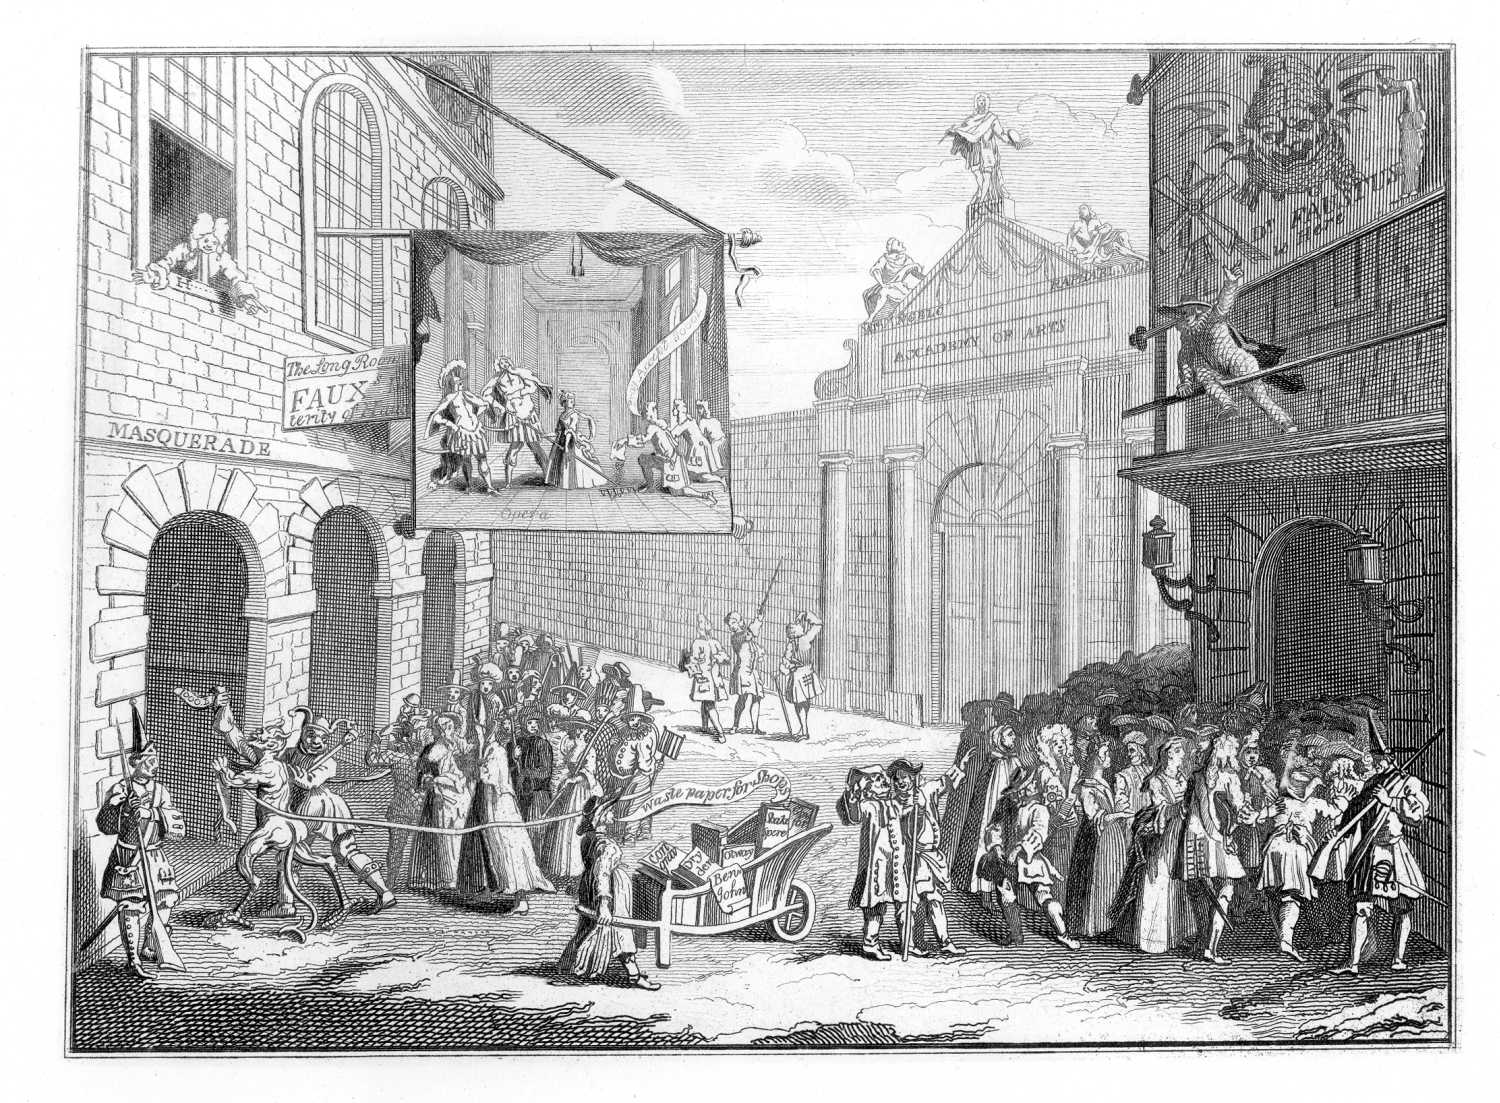
O how refin’d how elegant we’re grown!
What noble Entertainments Charm the Town!
Whether to hear the Dragon’s roar we go,
Or gaze surpriz’d on Fawks’s matchless Show,
Or to the Opera’s, or to the Masques,
To eat up Ortelans, and empty Flasques
And rifle Pies from Shakespear’s clinging Page,
Good gods! how great’s the gusto of the Age.
This is from London in 1724: William Hogarth’s engraving, Masquerades and Operas (larger version here; with engraved text, but smaller, here). At the center, a woman pushes a wheelbarrow containing books labeled, with variant spellings, Congreve, Dryden, Otway, Shakespeare, Foe, Ben Jonson, and possibly Addison. With a text ribbon she cries, “Waste paper for Shops.” On the left, a fool and a satyr holding up a purse labeled 1000£ lead a crowd into a Masquerade house and a performance by Faux’s (Fawkes). On the showcloth labeled opera, the Earl of Peterborough, along with two other English nobles, kneels to three Italian opera performers (Berenstadt, Cuzzoni, and Senesino), pours out a bag of gold, and says, “Pray Accept 8000£.” On the right, a large crowd is going into a pantomime performance of Dr. Faustus. In the background, the Earl of Burlington gestures toward the roof of the closed Academy of Arts.

Fawkes was a street fair entertainer like those at eighteenth-century Parisian trade fairs. A London newspaper advertisement in 1726 describe what Fawkes offered spectators:
first, his surprizing Dexterity of Hand, in which he far exceeds all that ever pretended to the same Art, with his Cards, Eggs, Mice, Money, and several Curious Birds from divers Parts of the World that never were seen here before. 2d. His famous Posture Master, who is allowed to be the best in Europe of that kind. 3d. His Musical Clock that plays Variety of Tunes on the Organ, Flute and Flagelet, with Birds whistling and singing as natural as Life. 4th. His Puppet Show, with the Comical Humours of Punch and his Wife Joan : Likewise a Court of the richest and largest Figures ever shown in England, being as big as Men and Women.
This is popular culture in a commercially thriving city. Today, it’s moved to the Internet.
* * * * *
Note: Print description details and advertisement text from Catalogue of Prints and Drawings in the British Museum, v. 2 (1873), and John Trusler, The Works of William Hogarth (1833).
early telephone business relatively stable
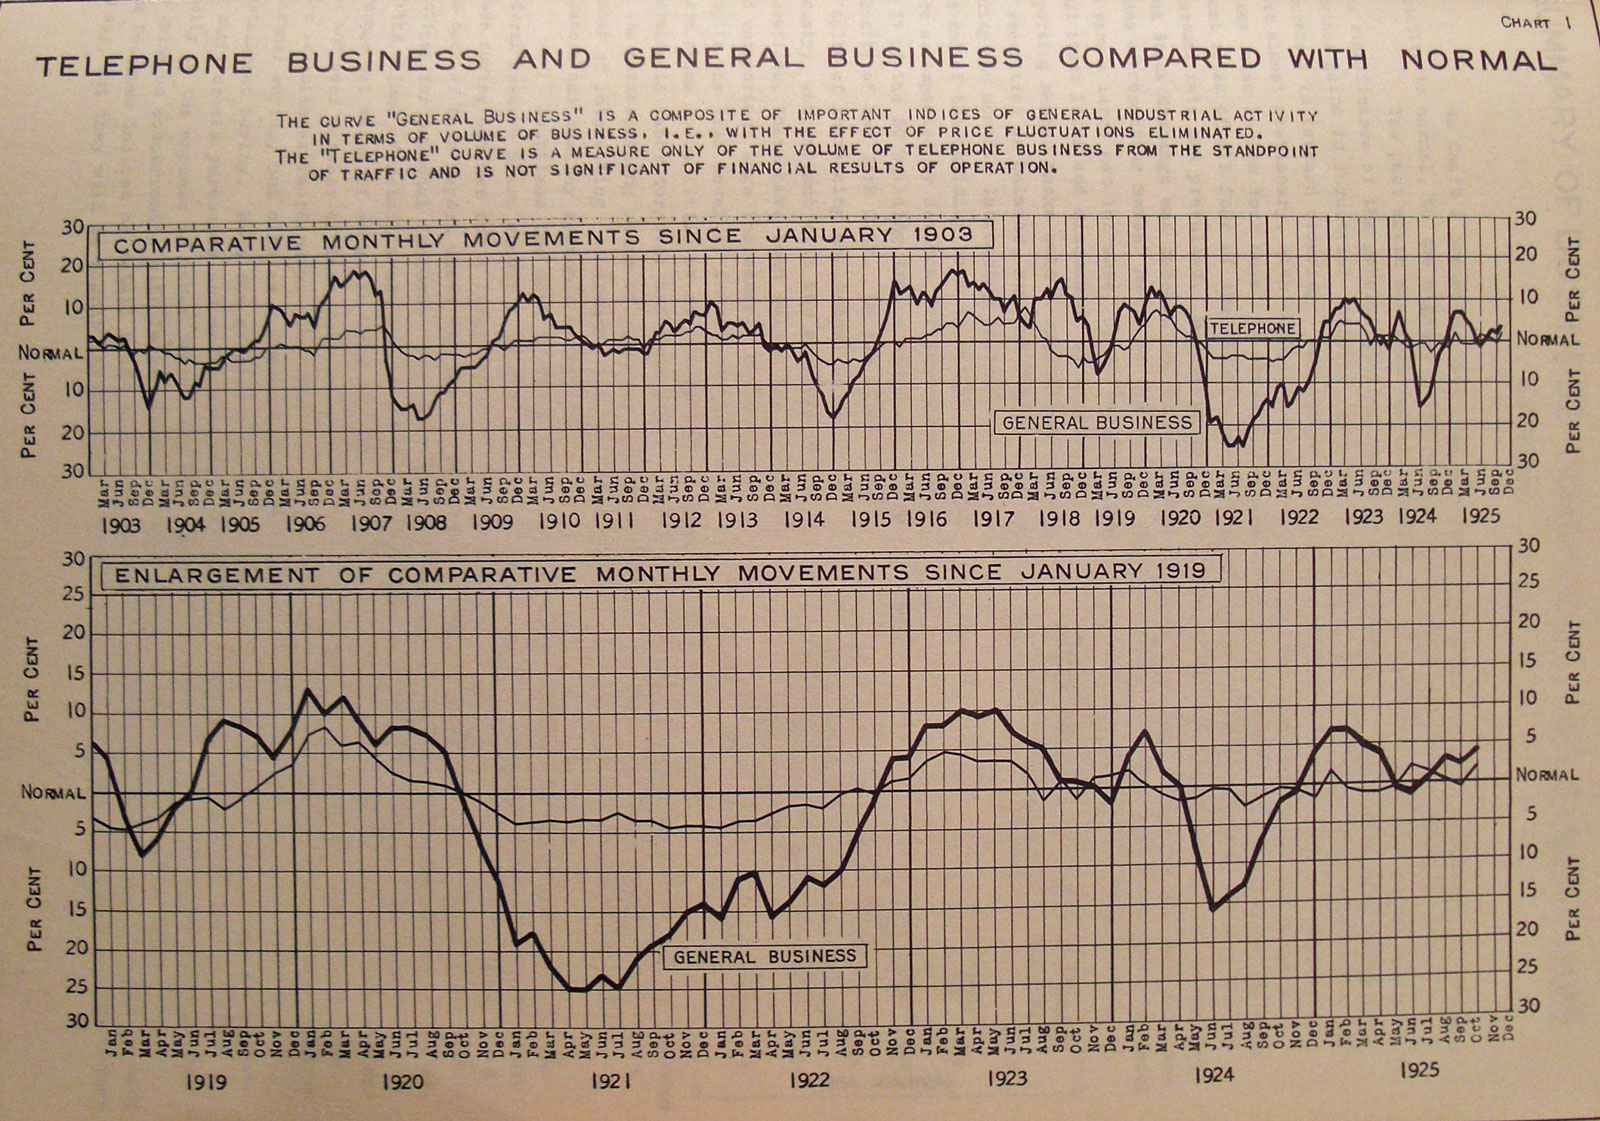
By October, 1923, American Telephone & Telegraph (AT&T) was producing a monthly booklet summarizing business conditions in the U.S. The booklet presented movements in macroeconomic indices and described general business conditions by Bell operating company regions. It also highlighted real business activity compared to telephone traffic.[1] The relevant chart from the November, 1925 booklet is shown above (larger image here). The chart highlights that telephone traffic is significantly more stable than the general volume of business.
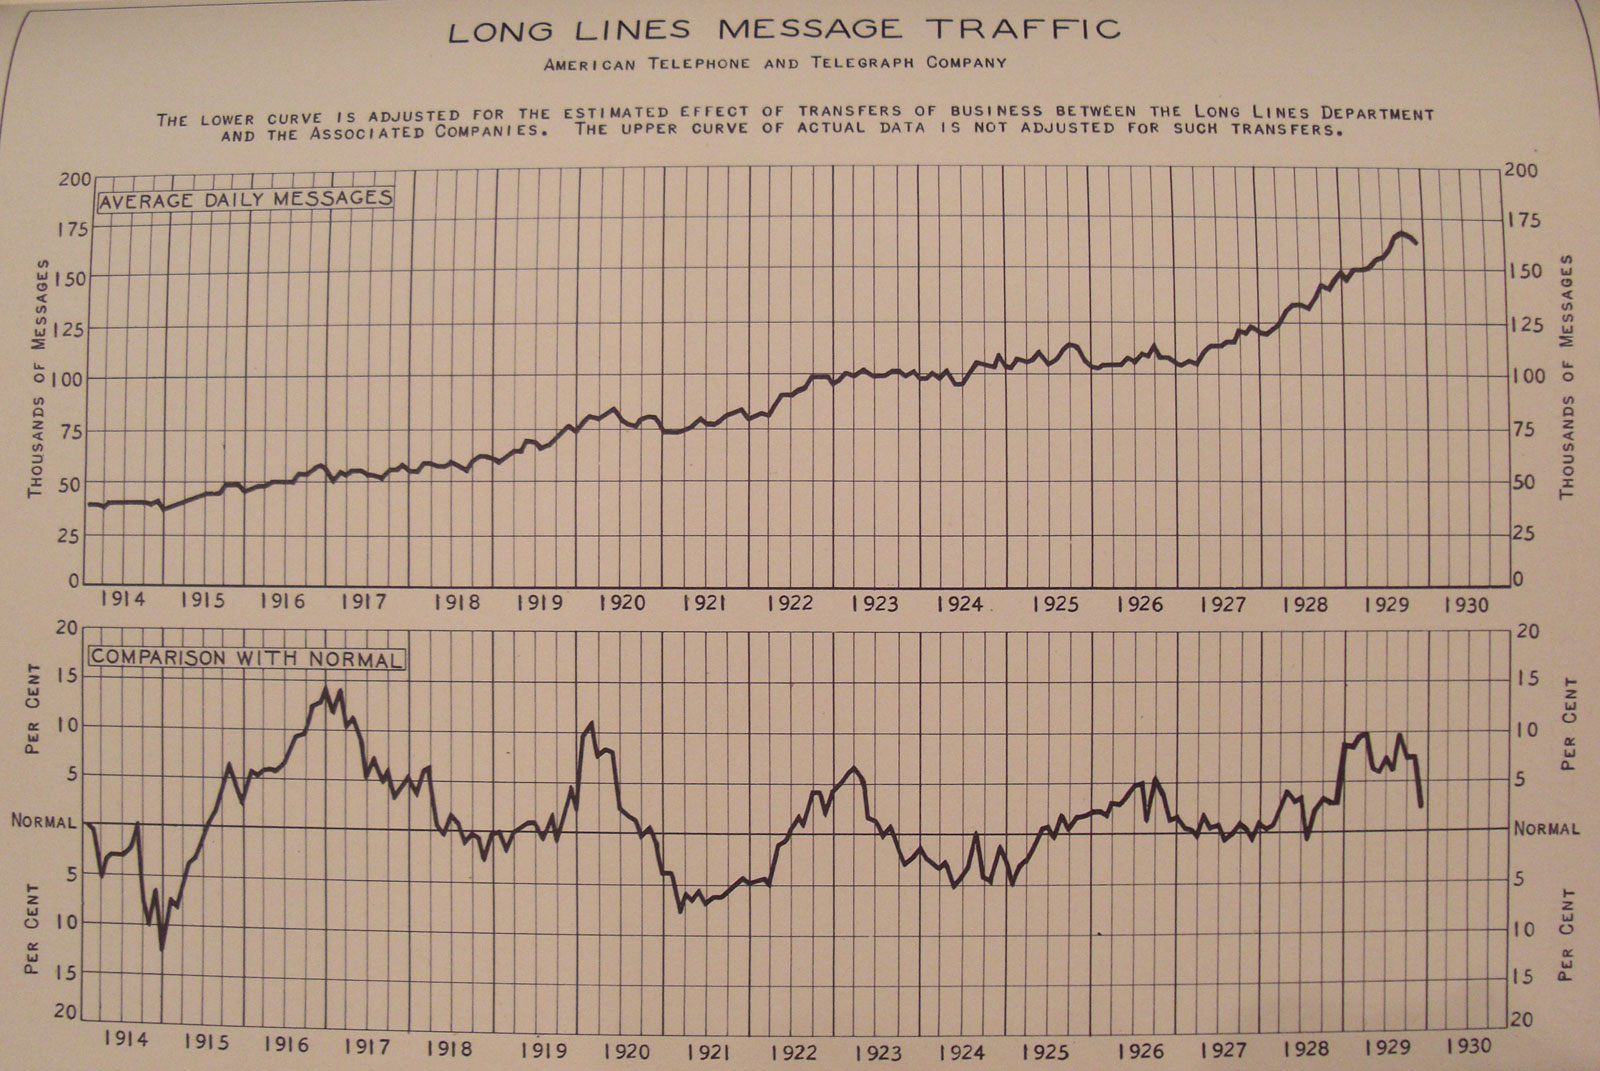
All telephone traffic was more stable than just long-distance telephone traffic. The booklet included two other charts (large image) describing AT&T’s long-distance telephone traffic (long lines message traffic). One chart shows the robust growth of long-lines message traffic. From Dec., 1902, to Sept. 1929, AT&T long lines traffic grew equivalent to a steady 9.7% growth per year.[2] Another chart adjusted for long-run trends and seasonal effects to show fluctuations in long-lines traffic. In the business boom of late 1907, the general business volume was 18% higher than normal; long-lines traffic, spiky, but on average about 8% higher than normal; and overall telephone traffic, 4% higher than normal. In the economic boom of early 1920, general business was 12% above normal; long-lines traffic, 10% above normal; and overall telephone traffic, 8% above normal. A relatively higher share of business use and higher cost probably explains the greater volatility of long-distance traffic relative to (predominately local) overall traffic. That AT&T compared overall telephone traffic, rather than long-lines traffic, to the general business index suggests that AT&T wanted to emphasize the stability of the telephone business.

The Great Depression of the early 1930s provides a larger example of the relative stability of the telephone business. Telephone census data indicate that calls per telephone rose across the Great Depression, while the number of telephones in service fell about 6%. These data are for the telephone censuses of 1927 and 1932. Monthly telephone data provide better temporal resolution. Monthly telephone data show that the number of telephones peaked in July 1930, and bottomed in August, 1933. The overall fall in the number of telephones was probably about 19% (using a plausible adjustment for reporting changes).[3] The fall in real GDP across the Great Depression was 27%, with manufacturing production falling nearly 40%. The fall in food and textile production, in contrast, was similar to that of telephones.[4] This pattern suggests that, by the early 1930s, telephones had become quite important to those persons who had them.
* * * * *
Data: U.S. telephone data, 1902 to 1943 (Excel version)
Notes:
[1] AT&T included a similar chart in its 1919 Annual Report (pp. 44). Under the heading “Stability of the Telephone Business,” the previous page stated:
Not only does the telephone business grow steadily even in times of business depression, as is shown by the diagram on the back cover of this report [diagram showing the number of Bell Telephones in service, from 1876 to the present], but that it does not suffer any substantial retardation in its normal growth during such periods, appears from the chart on the following page.
The telephone business varies very slightly from its normal growth as compared with the fluctuations of general business. This is an element of security and enables the business to be carried on with a lower margin of surplus earnings than would be safe in general industrial undertakings.
The exact composition of the general business volume index that AT&T constructed isn’t clear. The index generally tracks modern reference dates for business cycle expansions and contractions. The index apparently is a composite of business volume indices for construction, iron and steel, copper, textiles, and miscellaneous industries, with perhaps also indices for trade and transportation and agriculture.
[2] Charts extending out to Sept. 1929: (1) business fluctuations, (2) long-lines traffic. Here’s data read from the charts and the growth calculation.

[3] The monthly series shows a decline of 17%, the same as the change from 1930 to 1933 in annual telephone data. However, growth in the share of telephone companies covered in the monthly series (the Bell System and other large telephone companies) suggests that the coverage-constant change probably would have been a few percentage points higher.
[4] Data in the general business volume spreadsheet.
Reference:
Summary of business conditions in the United States (New York: American Telephone & Telegraph, Comptroller’s Department), monthly issues from at least Oct. 1923 to 1957. After 1930, the publication doesn’t include data on the telephone industry.
the joy of things
Things are crucial to human social networks. Some things never lose their appeal.
Wednesday's flowers